Logfire Integration
Visualize and analyze evaluation results using Pydantic Logfire.
Overview
Pydantic Evals uses OpenTelemetry to record traces of the evaluation process. These traces contain all the information from your evaluation reports, plus full tracing from the execution of your task function.
You can send these traces to any OpenTelemetry-compatible backend, including Pydantic Logfire.
Installation
Install the optional logfire dependency:
pip install 'pydantic-evals[logfire]'
Basic Setup
Configure Logfire before running evaluations:
import logfire

from pydantic_evals import Case, Dataset

# Configure Logfire
logfire.configure(
    send_to_logfire='if-token-present',  # (1)!
)


# Your evaluation code
def my_task(inputs: str) -> str:
    return f'result for {inputs}'


dataset = Dataset(cases=[Case(name='test', inputs='example')])
report = dataset.evaluate_sync(my_task)
- Sends data to Logfire only if the
LOGFIRE_TOKENenvironment variable is set
That's it! Your evaluation traces will now appear in the Logfire web UI as long as you have the LOGFIRE_TOKEN environment variable set.
What Gets Sent to Logfire
When you run an evaluation, Logfire receives:
- Evaluation metadata
- Dataset name
- Number of cases
- Evaluator names
- Per-case data
- Inputs and outputs
- Expected outputs
- Metadata
- Execution duration
- Evaluation results
- Scores, assertions, and labels
- Reasons (if included)
- Evaluator failures
- Task execution traces
- All OpenTelemetry spans from your task function
- Tool calls (for Pydantic AI agents)
- API calls, database queries, etc.
Viewing Results in Logfire
Evaluation Overview
Logfire provides a special table view for evaluation results on the root evaluation span:
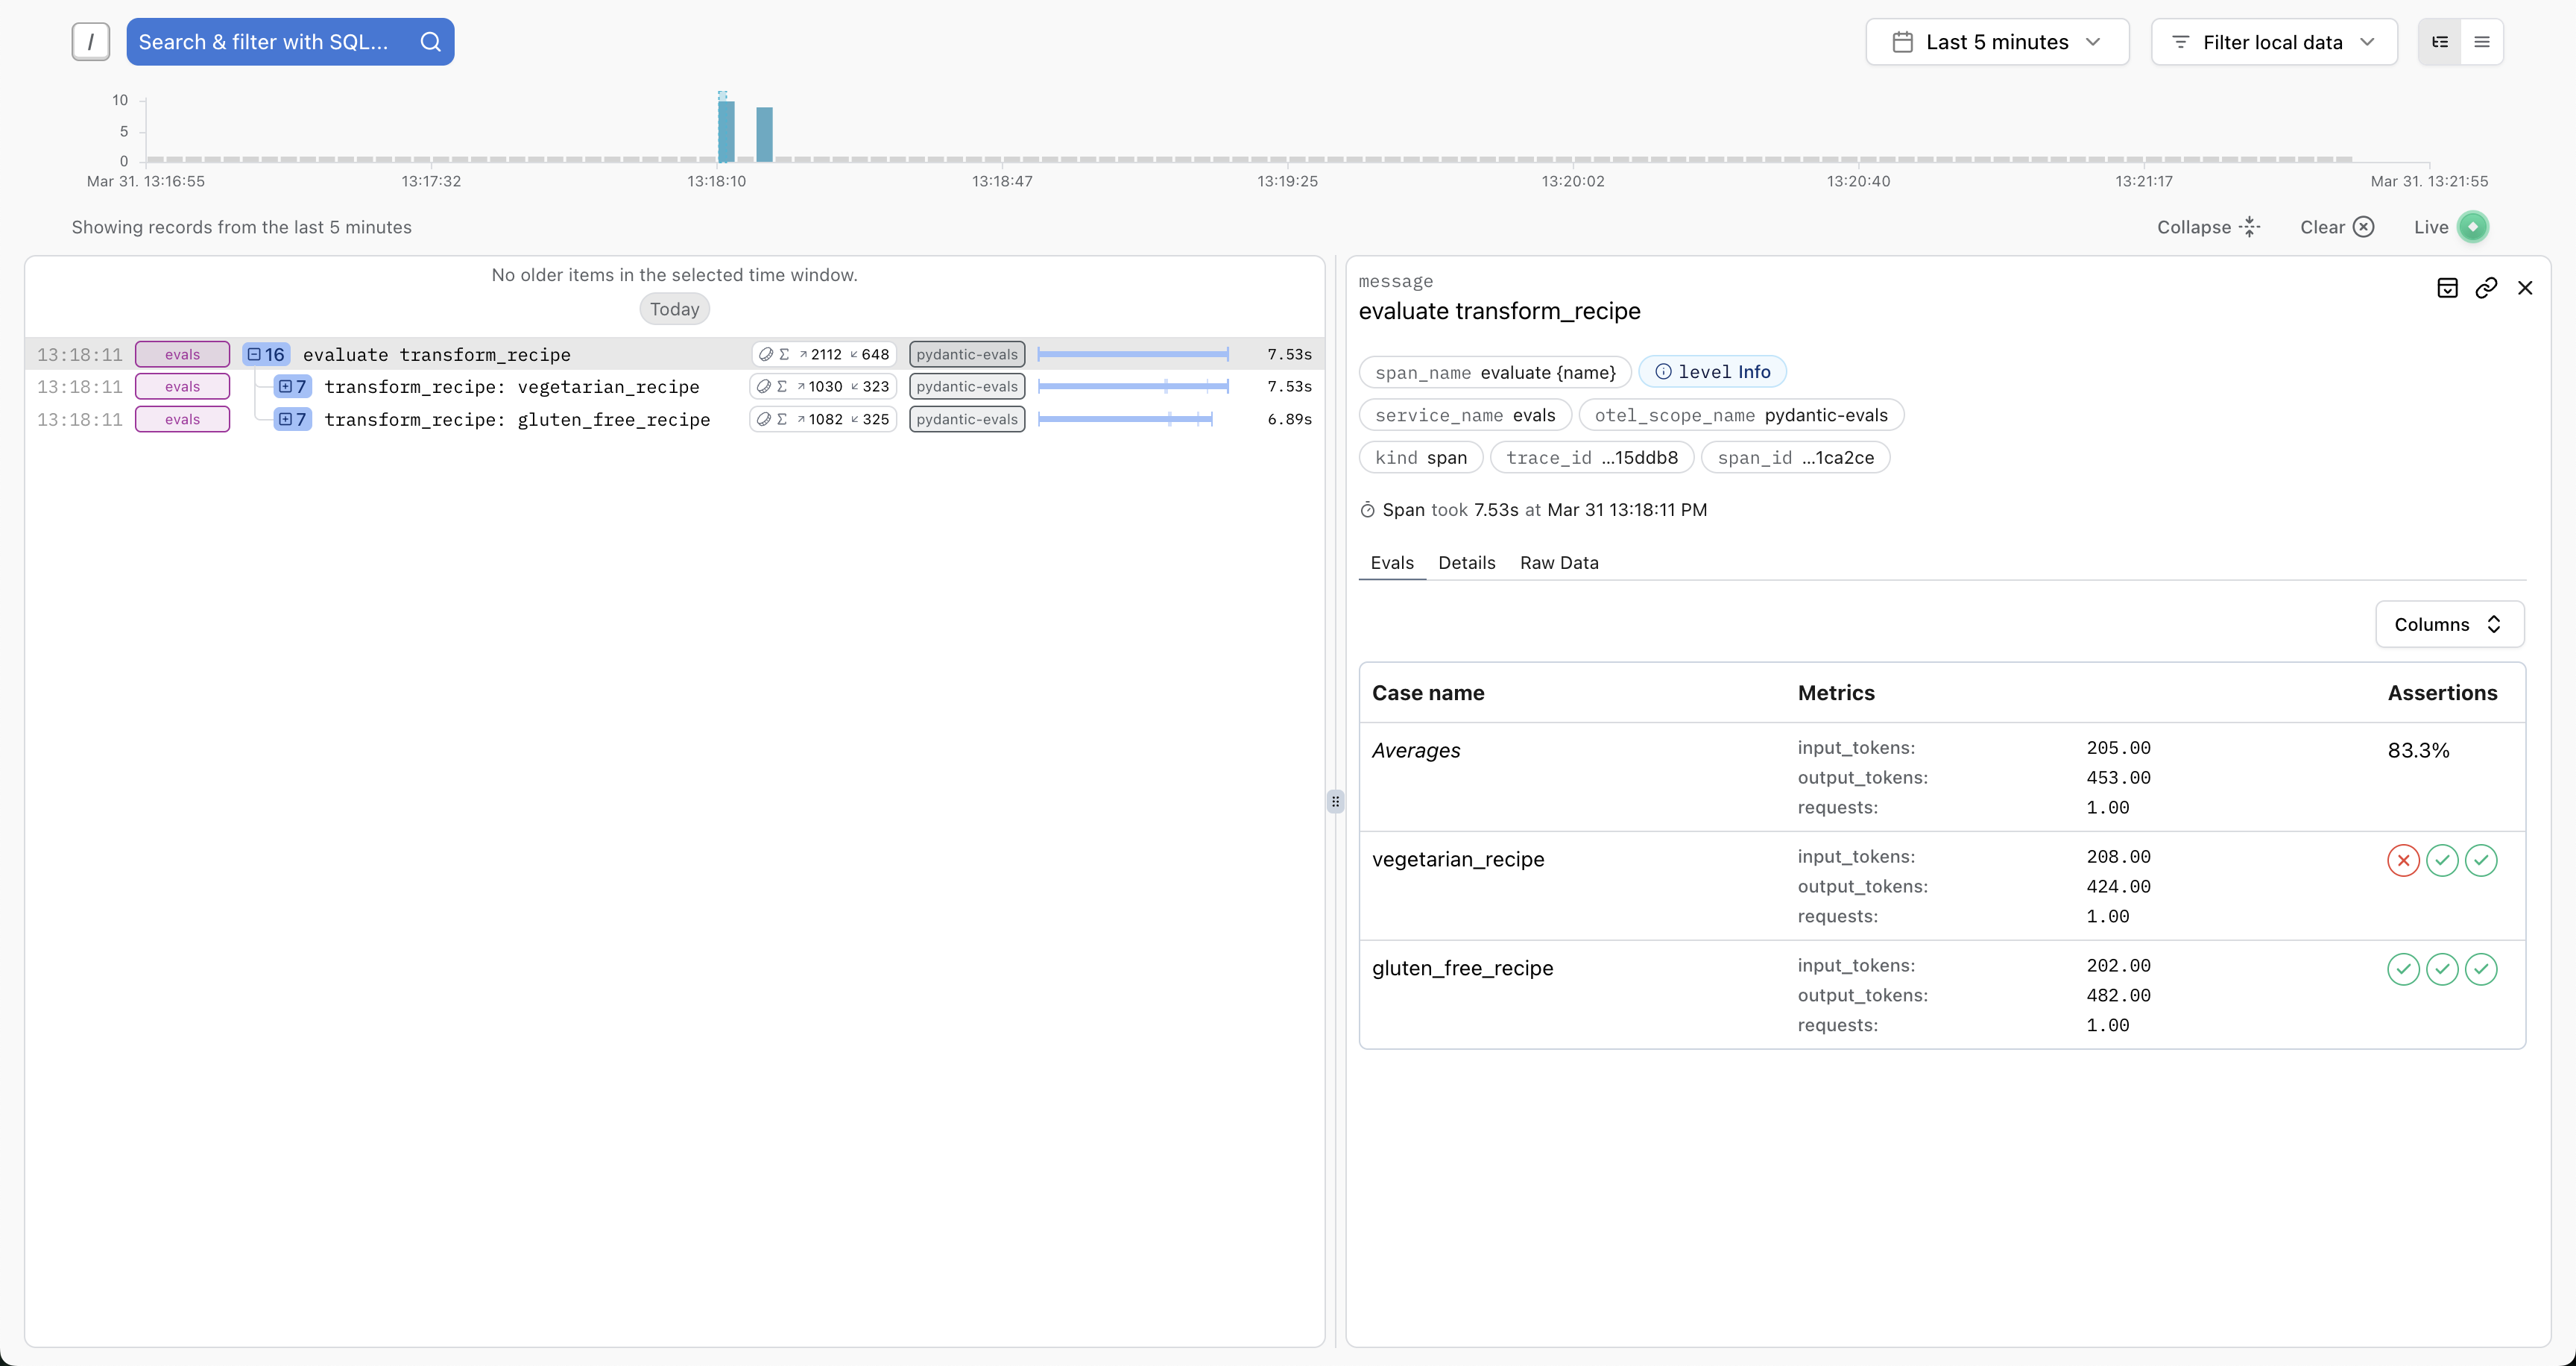
This view shows:
- Case names
- Pass/fail status
- Scores and assertions
- Execution duration
- Quick filtering and sorting
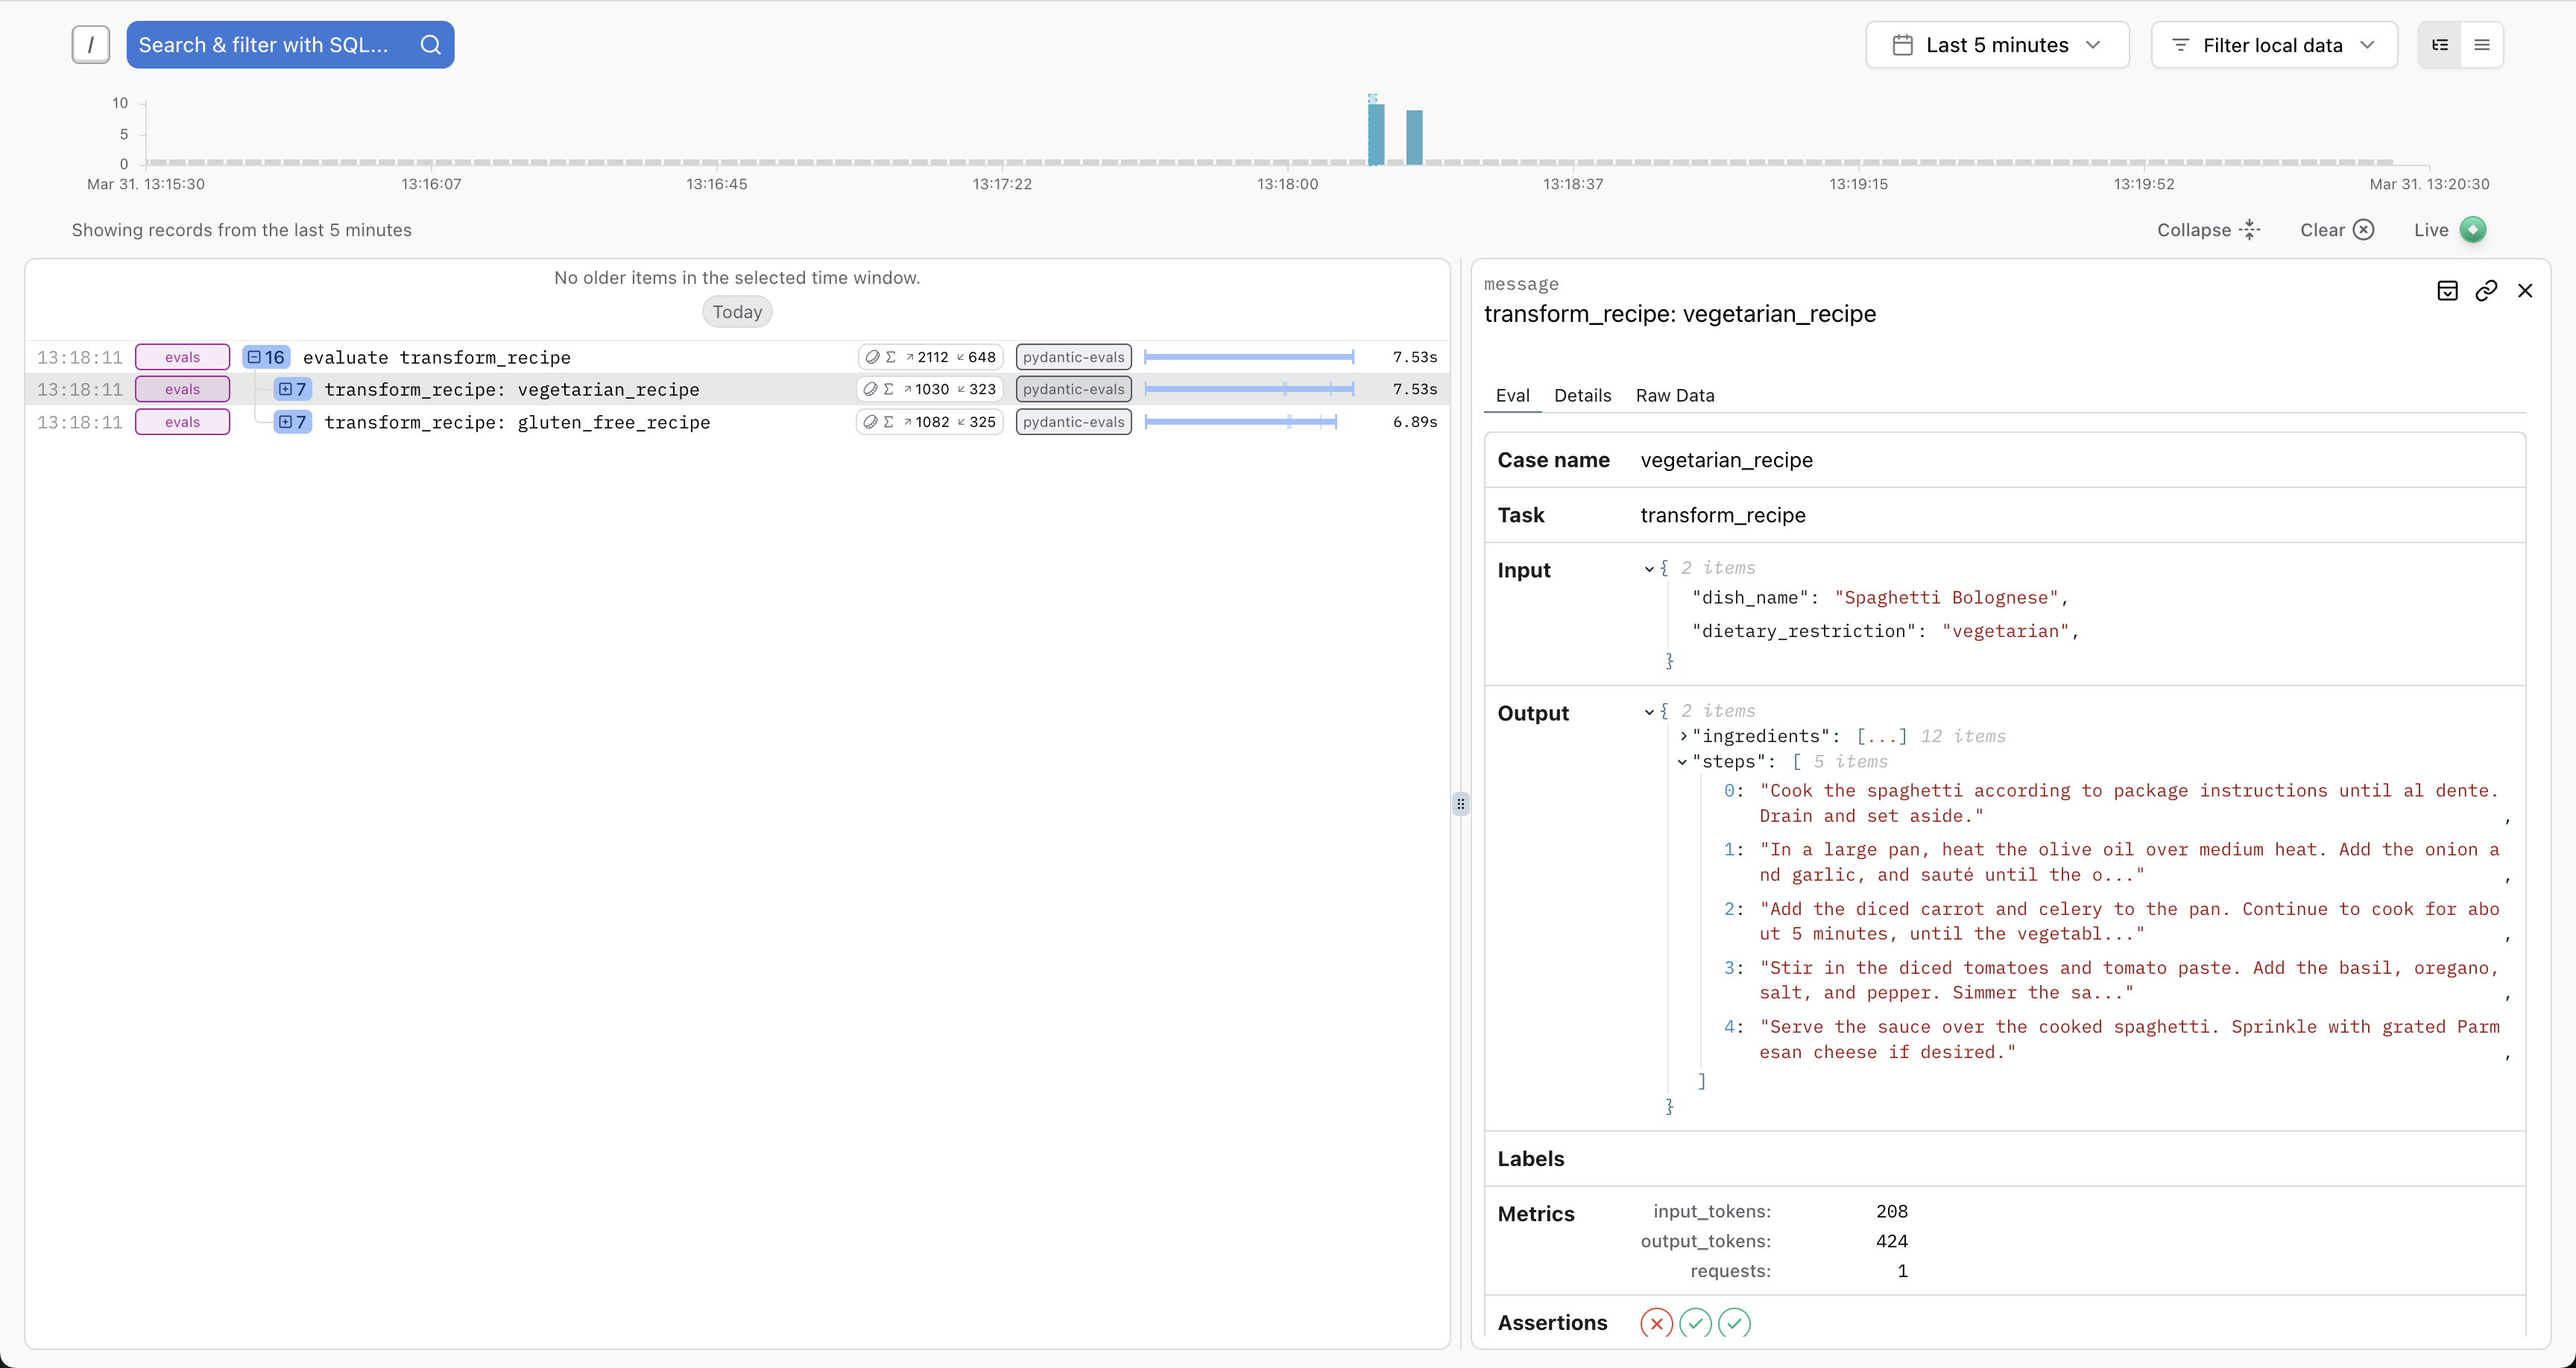
Individual Case Details
Click any case to see detailed inputs and outputs:
Full Trace View
View the complete execution trace including all spans generated during evaluation:
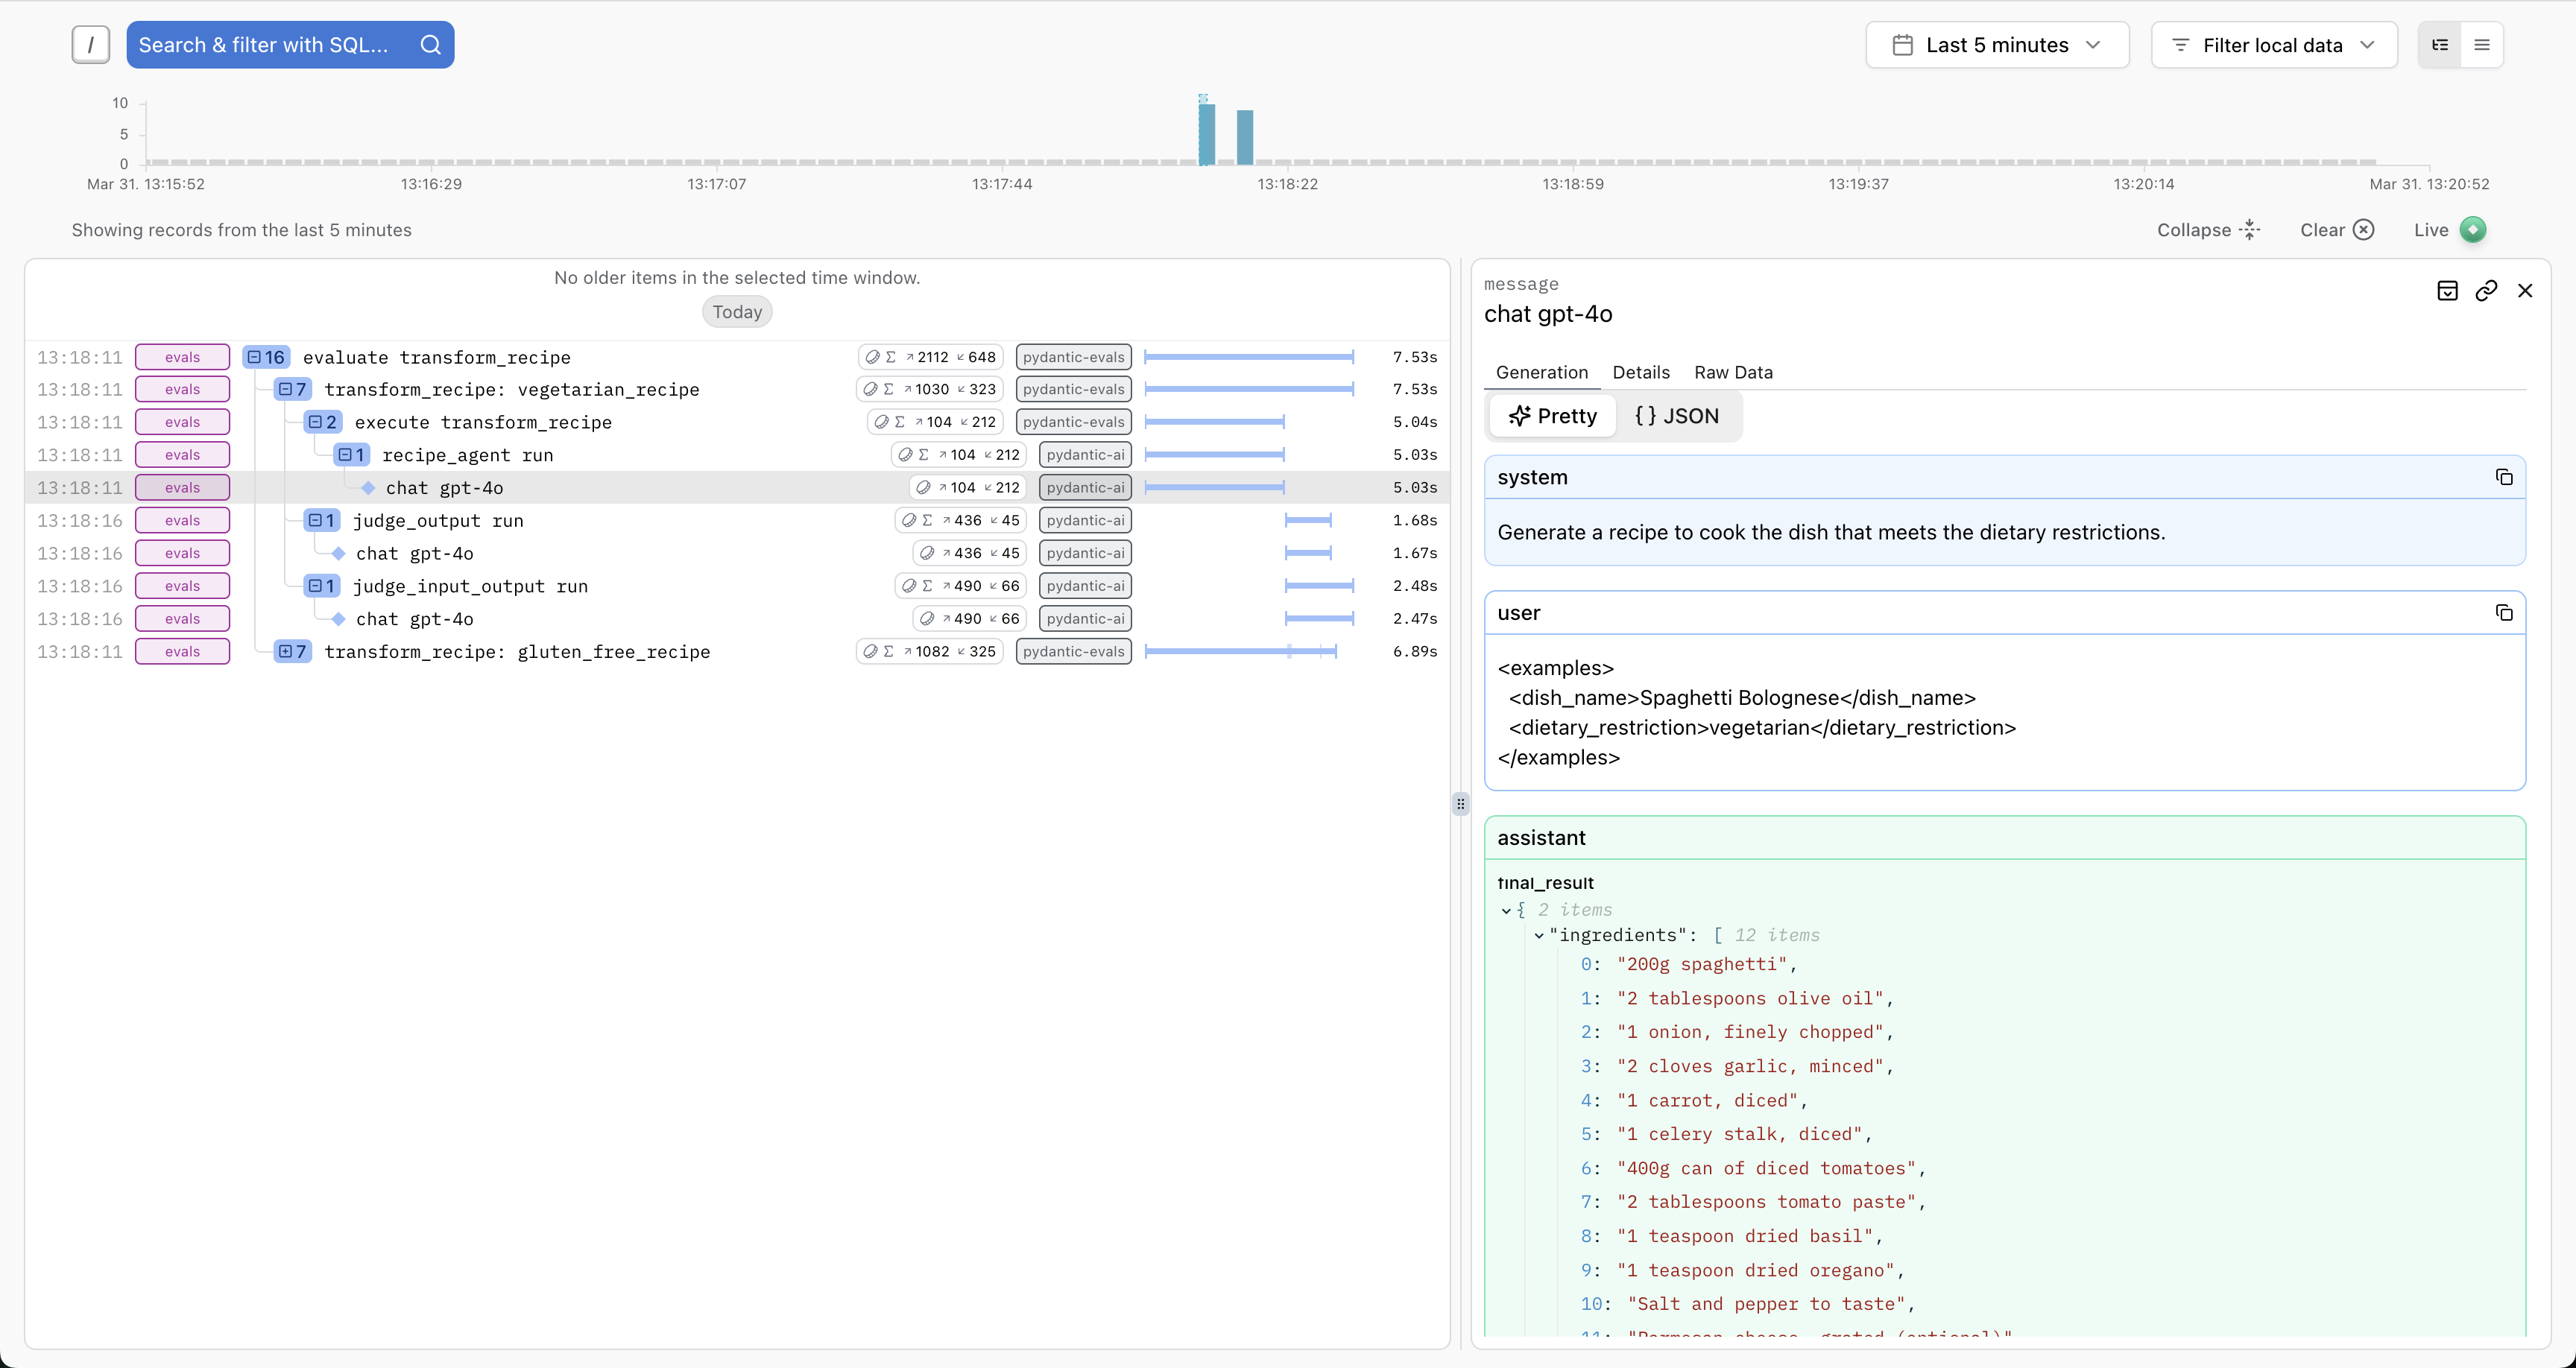
This is especially useful for:
- Debugging failed cases
- Understanding performance bottlenecks
- Analyzing tool usage patterns
- Writing span-based evaluators
Analyzing Traces
Comparing Runs
Run the same evaluation multiple times and compare in Logfire:
from pydantic_evals import Case, Dataset


def original_task(inputs: str) -> str:
    return f'original result for {inputs}'


def improved_task(inputs: str) -> str:
    return f'improved result for {inputs}'


dataset = Dataset(cases=[Case(name='test', inputs='example')])

# Run 1: Original implementation
report1 = dataset.evaluate_sync(original_task)

# Run 2: Improved implementation
report2 = dataset.evaluate_sync(improved_task)

# Compare in Logfire by filtering by timestamp or attributes
Debugging Failed Cases
Find failed cases quickly:
- Search for
service_name = 'my_service_evals' AND is_exception(replace with the actual service name you are using) - View the full span tree to see where the failure occurred
- Inspect attributes and logs for error messages
Span-Based Evaluation
Logfire integration enables powerful span-based evaluators. See Span-Based Evaluation for details.
Example: Verify specific tools were called:
import logfire

from pydantic_evals import Case, Dataset
from pydantic_evals.evaluators import HasMatchingSpan

logfire.configure(send_to_logfire='if-token-present')


def my_agent(inputs: str) -> str:
    return f'result for {inputs}'


dataset = Dataset(
    cases=[Case(name='test', inputs='example')],
    evaluators=[
        HasMatchingSpan(
            query={'name_contains': 'search_tool'},
            evaluation_name='used_search',
        ),
    ],
)

report = dataset.evaluate_sync(my_agent)
The span tree is available in both:
- Your evaluator code (via
ctx.span_tree) - Logfire UI (visual trace view)
Troubleshooting
No Data Appearing in Logfire
Check:
- Token is set:
echo $LOGFIRE_TOKEN - Configuration is correct:
import logfire logfire.configure(send_to_logfire='always') # Force sending - Network connectivity: Check firewall settings
- Project exists: Verify project name in Logfire UI
Traces Missing Spans
If some spans are missing:
-
Ensure logfire is configured before imports:
import logfire logfire.configure() # Must be first -
Check instrumentation: Ensure your code has enabled all instrumentations you want:
import logfire

logfire.instrument_pydantic_ai()
logfire.instrument_httpx(capture_all=True)
Best Practices
1. Configure Early
Always configure Logfire before running evaluations:
import logfire

from pydantic_evals import Case, Dataset

logfire.configure(send_to_logfire='if-token-present')


# Now import and run evaluations
def task(inputs: str) -> str:
    return f'result for {inputs}'


dataset = Dataset(cases=[Case(name='test', inputs='example')])
dataset.evaluate_sync(task)
2. Use Descriptive Service Names And Environments
import logfire

logfire.configure(
    service_name='rag-pipeline-evals',
    environment='development',
)
3. Review Periodically
- Check Logfire regularly to identify patterns
- Look for consistently failing cases
- Analyze performance trends
- Adjust evaluators based on insights
Next Steps
- Span-Based Evaluation - Use OpenTelemetry spans in evaluators
- Logfire Documentation - Complete Logfire guide
- Metrics & Attributes - Add custom data to traces